Procore Design Metrics
Procore Overview
Procore is a SaaS company providing construction management tools to General Contractors. My role was leading the Platform design team, which was divided into 3 sub-teams:
Flexibility – responsible for workflow tool & custom fields
Identity – working on permissions & directory
Data – created products to improve customers’ efficiency and effectiveness based on their data
All squads and teams across Procore were led by a Product/Engineering/Design tripod, but in reality product managers were “first among equals.”
Challenge
Given the structure and culture at Procore, Design was viewed more as a tactical resource, rather than a strategic partner, and our Product and Engineering colleagues did not understand the value of connecting user goals to business goals.. The team was valued, but we were mainly perceived as wireframe producers, and were often brought in relatively late in the process to comment on things like strategy and road maps.
Action
In the spirit of “show, don’t tell,” we decided to create a set of design metrics that laddered up to Procore’s North Star Metric to provide empirical evidence of the business benefit of addressing user goals
Result
We were able to implement some metric tracking for the Workflow product, and while that was only one of a number of products Procore offers, the results had an outsized impact:
This effort changed the conversation among the tripod members – it clarified what was previously a mushy process, and enabled Product and Engineering to connect user goals with business goals
It also helped Product & Engineering understand the value of Design. They realized that UX was not just about polishing wireframes, and began to see how focusing on user outcomes contributed to the business
Finally, Design became an active participant in strategy and planning discussions

North Star Metric
•Procore had established a North Star Metric of “Project Activity,” based on
research indicating that customers who had a certain amount of project activity
had a significantly lower churn rate
•As a pilot we selected the Workflow Tool, which was starting a significant
redesign effort
•Workflow was a strategically important product as it enabled customers to
submit, review and approve anything from drawings to invoices
Challenge: How might we measure the impact of our design improvements on the North Star Metric?

Approach
•Looked at examples from other companies, and noticed their metrics were all
aligned to their context, and were leading indicators, not trailing
•Evaluated which type of goal Procore’s product suite was focused on:
Attention (Facebook, Netflix), Transaction (Amazon, Walmart),
Productivity (Salesforce, Amplitude)
We determined that Procore was in the Productivity game

Spotify Model…
Ultimately settled on the Spotify model, as they refined their North Star Metric into 3 sub-metrics which we thought were particularly relevant to our situation:
•Breadth
•Depth
•Frequency

…Applied to Procore
We ran a number of team-level experiments/initiatives…
Breadth: How might we increase adoption across customers/projects? Simplify the template builder?
Efficiency: How might we reduce time to completion? Mobile approvals?
Frequency: Could we add new conditional rules and chain workflows automatically by conditionals?
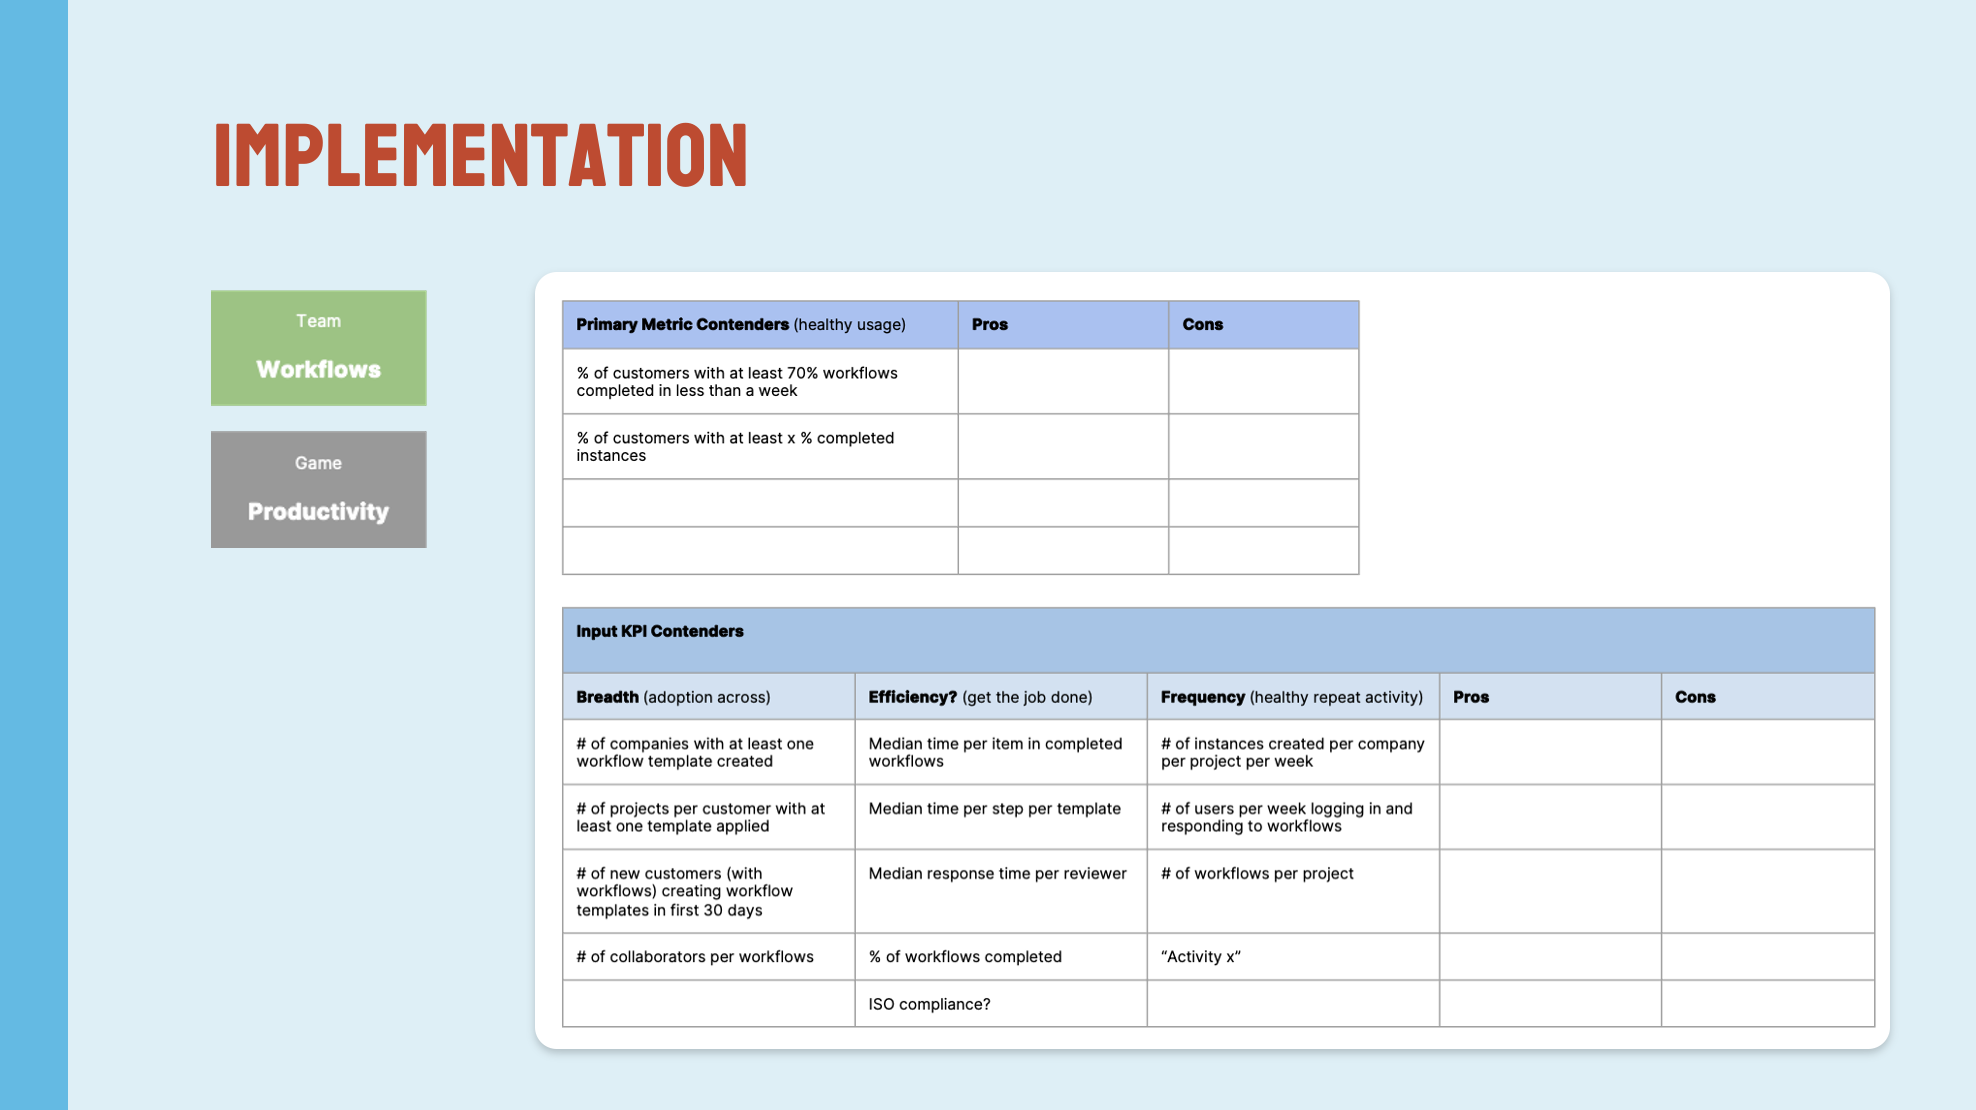
…That flowed up to team level input metrics/KPIs:
•Number projects per customer that had 1+ workflow templates applied
•Median time per item completed in workflow (how long to completion)
•Number of instances created per company/project
On the right you can see some of the principles, concerns & questions related to these items
Team level primary metric: How many of our customers completed at least 70% of their workflows in less than a week?
Finding Our Design Metrics
Ran workshops with each team’s tripod (Product/Design/Engineering) that used existing user research data and institutional knowledge to conduct journey-mapping sessions
•Mapped out the user journey and funnel for workflows
•Identified where in the journey there were valuable or success events for users
Process enabled the team to align around what ACTUALLY mattered to users
Metrics we identified were based on these "user success moments" – an eye opener for many in Product
Based on what came out of these workshops, performed any needed research, refined our approach, and iterated
In the workshops we used the chart to left to evaluate input KPI ideas based on our 3 vectors (Breadth, Efficiency and Frequency)
Warner Music Portal |Procore Design Metrics | Bloomberg Design System | WK Cheetah | WK Digital Imprint | JP Morgan ACCESS | WK Global Personas